West Kirby High Tide Roost 2001-2002
Data collected by the Dee Estuary Voluntary Wardens.
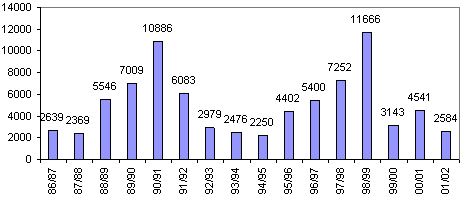
Although there was plenty of interest (see Chris Butterworth's article - the Wardening Year), it has to be said the 2001/2002 season at West Kirby wasn't the best as far as wader numbers go. The bar chart below shows the average count for every year since 1986/1987. It demonstrates a remarkable cyclic pattern and in fact, going on previous cycles, a low count is what would have been expected - and these should start to increase again the winter after next. The only problem is that the 1999/2000 winter just didn't follow this nice pattern so we don't really know whether we are still in a cycle or it has now become random (and low!).
West Kirby High Tide Wader Roost - Average counts 1986/87 to 2001/2002 
It should be noted that the bar chart above reflects above all else the number of Dunlin and Knot at the roost, by far the most numerous species. Other species increased last year - Oystercatchers, Sanderling and Redshank, so it's certainly not all bad news.
Four of the species which have shown the biggest declines - Ringed Plover, Grey Plover, Knot and Bar-tailed Godwit - are those that predominate along the North Wirral Shore rather than the Dee Estuary itself. We actually had some large numbers of these species this winter along the North Wirral with some record, or near record counts. Their main roost is at Hoylake, literally just around the corner from West Kirby - so why didn't they come to West Kirby as they have in the past? One possible explanation is that because the level of the sand bank at Hoylake is slowly rising there is a larger area to roost here, even at high tide, than previously. Hoylake is nearer their feeding grounds off Meols and Leasowe so they go to the nearest available roost. Is this just too simplistic? Time will tell!
| Oyster- catcher | Ringed Plover | Grey Plover | Knot | Sanderling | Dunlin | Bar-tailed Godwit | Curlew | Redshank | Total | |
| Average Count 2001-2002 | 565 | 15 | 50 | 436 | 12 | 1324 | 8 | 48 | 126 | 2584 |
| Average Count 2000-2001 | 325 | 57 | 129 | 942 | 3 | 2873 | 35 | 81 | 96 | 4541 |
| Maximum Count 2001-2002 | 8000 | 101 | 650 | 9000 | 200 | 10000 | 160 | 500 | 1011 | 12873 |
| Maximum Count 2000-2001 | 3500 | 260 | 1100 | 10000 | 50 | 19000 | 1000 | 1465 | 700 | 24990 |
Data provided and owned by the Dee Estuary Voluntary
Wardens, many thanks to Roy Palmer for compiling the data.